In this article we want to dive into how revenue metrics are calculated from financial transaction data like new revenue, expansion, contraction and churn.
To calculate transaction data we need two kinds of information:
1. A way to identify each individual customer like A.myshopify.com and B.myshopify.com
2. A definition of the revenue periods we want to compare. For Shopify apps, we use 30 day periods counting backwards.
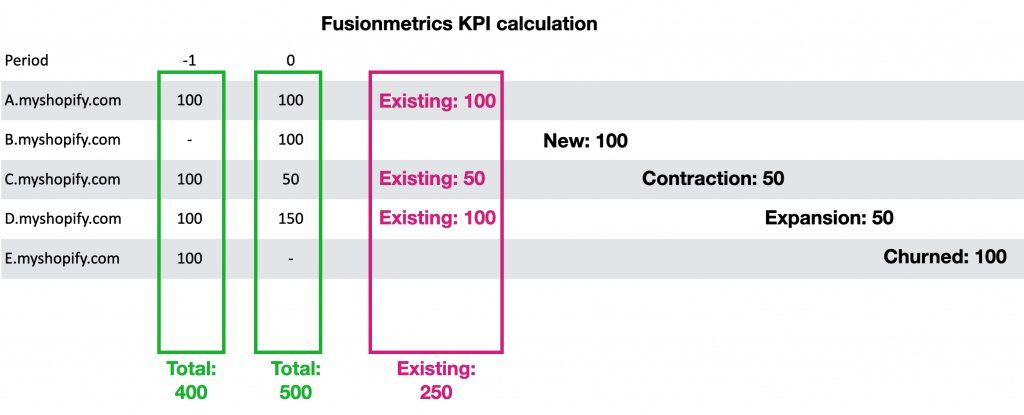
Total: Sum over all earnings in a 30 day period:
Existing: Revenue share of the current period that has been there in the last period
A – Revenue stayed the same -> 100 has been existing revenue
B – Previously no revenue -> no existing revenue and everything counted as new
C – We now have 50, which have been there before but the other 50 are now missing and are counted as contraction
D – We have 100 from before and another 50 which are counted as expansion
E – This has disappeared and is not seen at any point in the future, so the 100 from last month are counted as churned
From comparing the columns you can also see how this stacks up:
Total Current Period = Existing + New + Expansion
Whereas Churn and Contraction are stack up separately on a negative axis