Fusionmetrics offers detailed analysis on listing views and app installations for your Shopify applications. By merging data from Google Analytics and revenue metrics with user behavior analysis, we aim to help you comprehend the main contributors to your app’s value.
This guide demystifies how to interpret the attribution report and explains the roles of different columns in it.
The report is developed by integrating Google Analytics data from your Shopify app store listing page with merchant-specific data sourced from Shopify’s Partner API. This data is consolidated at the store level before displaying it in the form of traffic channels within individual lines in the report.
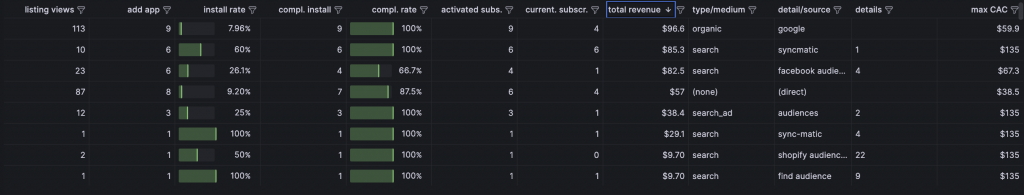
The report showcases the following key metrics:
- Listing views: Refers to the number of visitors on the Shopify app store listing connected to a specific traffic channel.
- Add App: Indicates the number of visitors who have attempted to initialize the application installation process by interacting with the “Add App” button.
- Install rate: Represents the ratio of instances where the “Add App” button was clicked to the total number of listing views.
- Compl. install: Tracks the number of successful app installations i.e., when the app authorisation step was accomplished without any hitches.
- Compl. rate: Corresponds to the ratio of complete installations to attempted installations (Add App). Particularly crucial for those using external advertising, as this rate can be significantly low for non-relevant traffic, such as non-merchants. Ideally, this value should be >50% for paid ads.
- Activated subs: How many merchants have at any point authorised billing.
- Current subs: How many merchants have currently authorised billing.
- Type/Medium: The type/medium information as reported by Google Analytics.
In case of CPC (payed ads outside Shopify app-store) we also add the ad network like “CPC – Google”. Other values are “search” for Shopify app-store search, search_ad for “Shopify app-store ads”, organic for search engine i.e. Google search or values manually set by utm_medium of an external link. - Detail/Source: In case of app-store traffic this show the search term used to arrive at the listing via app-store search or app store ads. In case of outside traffic it will show the “source” reported by Google Analytics and in case of CPC traffic we show the Campaign name.
- Details: In case of app-store internal traffic, we show the average search result rank for the search term. For CPC ads we show the ad-group derived from the utm_content parameter. Please make sure to include the ad-group name as utm_content parameter in the target-url of your ads pointing to the listing page.
- Max CAC: The maximum viable customer-acquisition-cost is derived from the conversion rate of a traffic channel and the overall customer lifetime value. Since we do not need the actual cost of acquisition this can be calculated for any traffic channel. To give an example let’s say we have a traffic channel in which 1 out of 5 customers that install the app becomes a paying customer. We know from our overall data that paying customers have a lifetime values of $100. We can then calculate that we can spend the the $100 to generate another 5 installs and out of which we expect another paying customer. Hence we see that (Max CAC) = (Lifetime Value)*(Conversion Rate). This value is of course just an estimate assuming things like a 100% operating margin and no channel specific conversion rate, but gives the right order of magnitude on what to spend on customer acquisition.
When opening the report all values correspond the the currently set time-span but you can change the time-frame on the upper left of the dashboard. This will then filter data down to the timeframe in which the listing-view or the signup-event happened and only these stores are considered in the downstream analysis.